Have you ever been in a meeting where someone panicked because “sales are way down this month”? I have, and it’s usually because they’re looking at incomplete current month data.
Picture this: It’s mid-July, and your sales dashboard shows July sales at $50K compared to June’s $150K. Panic ensues. But the reality? We’re only halfway through July, so of course the numbers look low! Here is how I handled this scenario –
Step 1: Created the SalesEOM Measure
I created SalesEOM measure which is total sales except that it would only return values until previous month, and will return zero for the current month values :
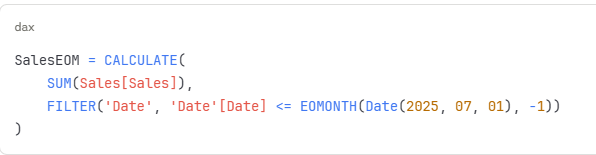
Note: I’m using the hardcoded Date(2025, 07, 01) for illustration only. Use the built-in TODAY() function, and the measure automatically adjusts to show data through the previous complete month.
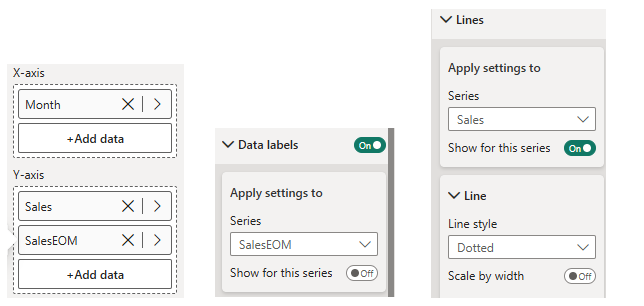
Step 2: Enhanced the Visual Design
Next, I included this new measure in my visual along with Total sales, changed the Total Sales to dotted line and removed data labels for the new measure.
Step 3: Added Conditional Tooltips
Finally, I created a custom tooltip that conditionally displays a message explaining that data is still being processed for the current month.
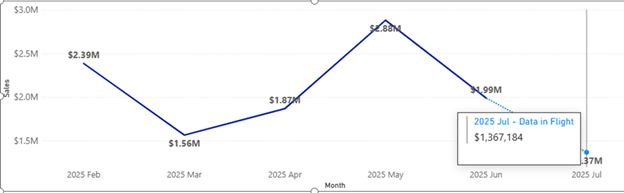
The Result
This transparent visual approach helped everyone immediately understand what they were seeing. No more confusion, no more panic—just clear, actionable insights.
Leave a Reply
You must be logged in to post a comment.